Test

Develop

Launch

Features

Our platform automates the most effective data analytics in market research, enabling you to make the most out of your data. Listed here are our most popular analyses, including the world’s best-in-class models developed from research, consulting, and academia, as well as other proprietary models that we offer.

Insights & Strategy Presentation

Interactive Reporting

Comparative analytics achieved with a click of a button empowers you to tell interactive stories, quickly answer questions, and compare results within business meetings in real-time. This gives you control over your data with an easy-to-use interface and significantly reduces time spent analysing data, generating graphs, and creating business strategy reports.

Import & Export Data

Easily import CSV data sets or integrate with Decipher to analyse existing data. Or export data collected and slides created using Zectr into PowerPoint or CSV formats to consolidate, analyse and compare your data, input into other data presentation applications, or download a copy for safe-keeping.

Consumer Segmentation

Consumer Segmentation with 3-D Mapping (Proprietary)

Relative, multivariate segmentation uniquely enables us to cross-compare an unlimited number of variable combinations to find the most significant patterns in your data. With the psychographic and demographic patterns identified, we are able to develop personas of unique population groups based on the data collected.

Instant Subgroup Analysis

Filter reports using any data-point collected to generate new sets of graphs and strategic recommendations. Achieve this with a click of a button, instead of using other traditional methods that may take days to weeks in order to build comparative reports.

Pricing

Interactive Westendorp Price Sensitivity Meter (PSM)

Easily compare acceptable price ranges across different subsegments with a click of a button. Using our platform, you can instantly determine the optimal price point for any consumer segment, and find those who value your product the most.

Interactive Demand Curve with Volume Projections

Using price points determined by the PSM model, you can simulate the impact these different price points have on volume demand for any subsegment. Additionally, you will be able to determine projected revenue and thus the total addressable market.

Branding

Interactive Centrality and Distinctiveness Map

Based on an analytical model developed at Harvard, the centrality and distinctiveness map helps you identify how each positioning strategy impacts sales or pricing, manage your portfolio of brands, and keep track of potential competitive threats.

Drivers & Barriers Analysis with Revenue Correlations (Proprietary)

Identify which brand metrics have a larger impact on price acceptance, volume sales and revenue so you can develop core brand strategies that will impact business growth.

Product-Feature Optimisation

Sentiment Correlation with Satisfaction Scores (Proprietary)

Analyse consumer sentiments from reviews or any other text-based feedback to understand product features or services consumers are most happy with and what they are complaining about. This helps you identify core features to focus on and develop new product line extension opportunities.

Insights & Strategy Presentation

Interactive Reporting

Comparative analytics achieved with a click of a button empowers you to tell interactive stories, quickly answer questions, and compare results within business meetings in real-time. This gives you control over your data with an easy-to-use interface and significantly reduces time spent analysing data, generating graphs, and creating business strategy reports.

Import & Export Data

Easily import CSV data sets or integrate with Decipher to analyse existing data. Or export data collected and slides created using Zectr into PowerPoint or CSV formats to consolidate, analyse and compare your data, input into other data presentation applications, or download a copy for safe-keeping.

Sample Sizing

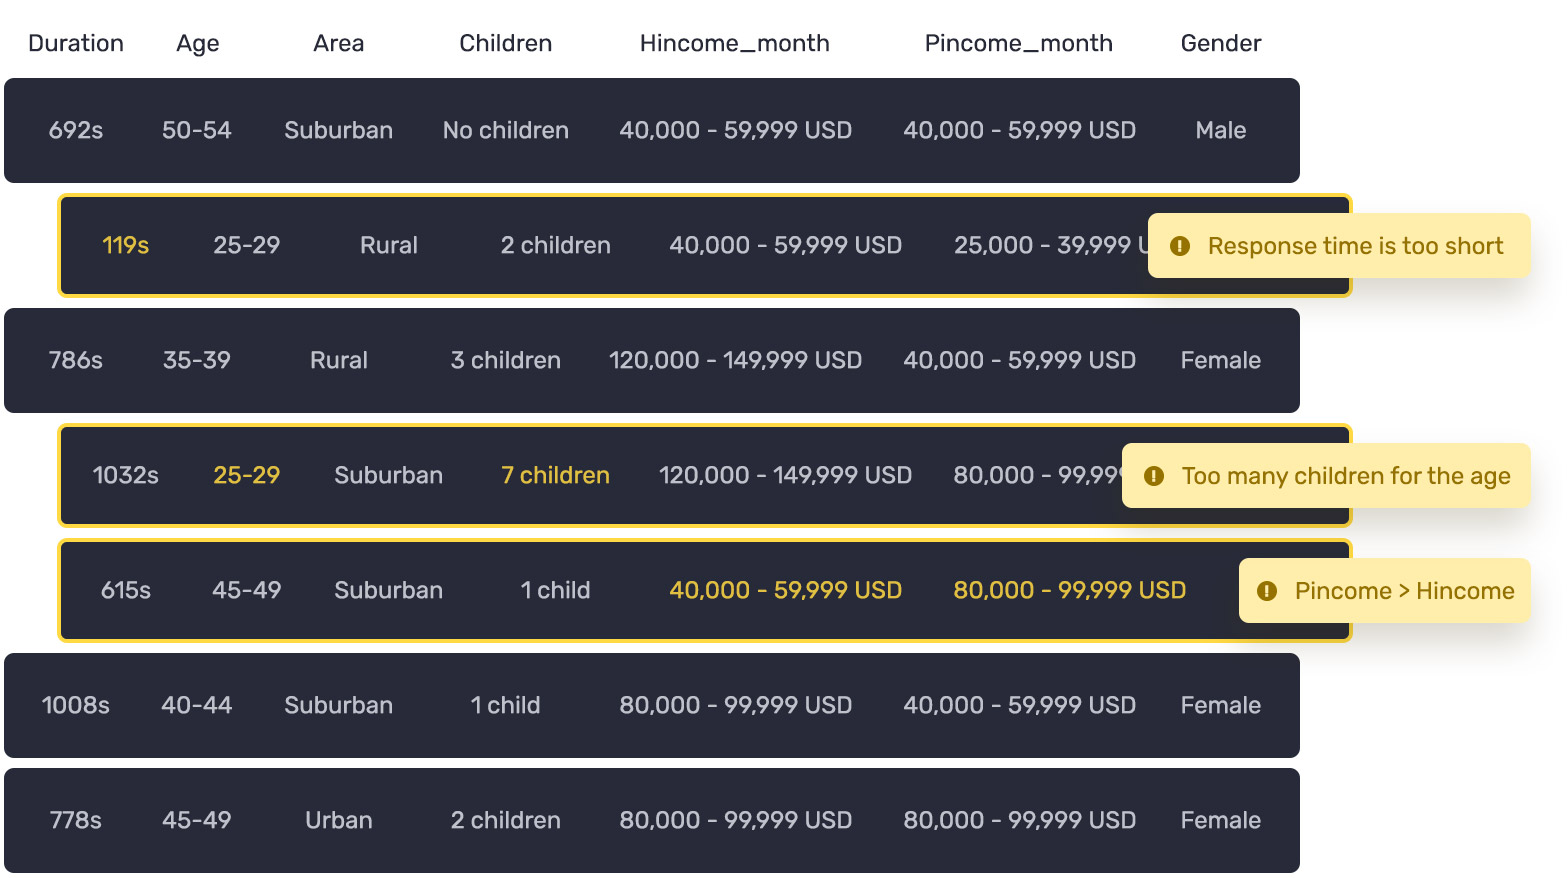
Junk Data Filtering (Proprietary)

Through our team’s combined 40+ years of experience handling consumer data, we’ve developed tools that help us automatically identify and filter out unreliable responses and respondents when using Zectr to collect data. Included in this are pattern recognition algorithms that detect for problematic data, time of response rates, and inconsistent long text form fills.

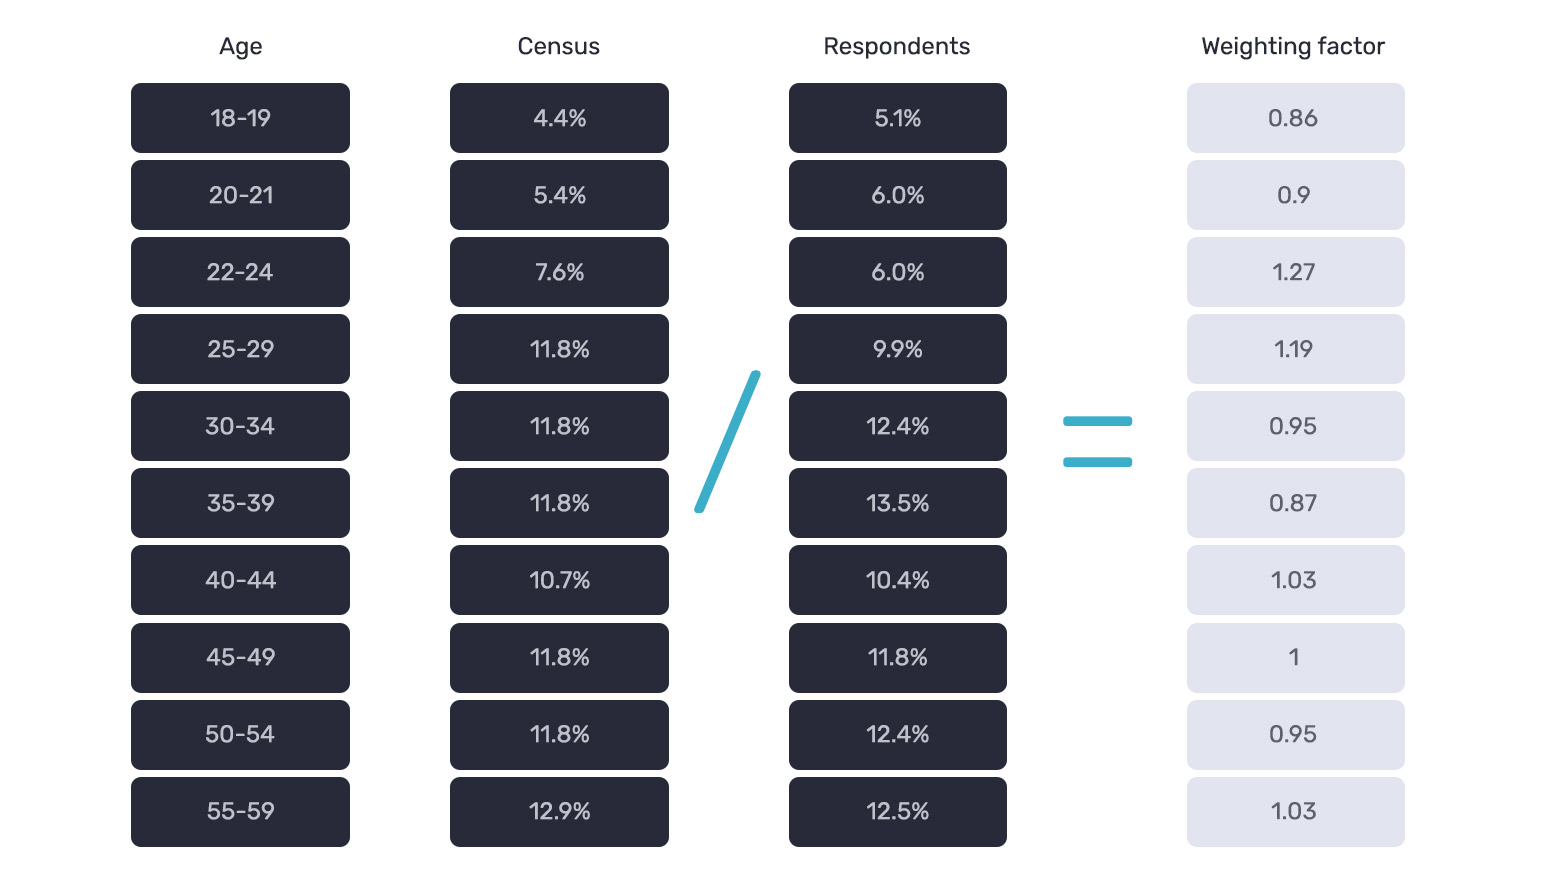
Population Weighting & Scaling

By using population weighting and scaling in accordance with census data, we ensure our reports are accurate and also simulate what results would look like in correspondence to the entire population of the cities or countries of interest.

See how Zectr can bring you closer to your customers so
you can focus on building products and marketing they love

Schedule a Demo