Pricing is both a science and an art. Setting your products and services at the right price can portray a certain level of quality, such as prestige or mass-market accessibility, and enables your company to maximize its profits. Achieving the perfect balance takes some research, testing, and calculations.
To demonstrate, we will be using Keurig Kold as an example. Keurig is a stellar company – this example is purely for business case study analysis and illustrative purposes only and in no way undermines the achievements and innovative efforts of Keurig.

In 2015, Keurig, positively known for its at-home single-serve K-cup coffee maker, strategically announced that it was entering the burgeoning at-home sparkling beverage maker market with the Keurig Kold.
While Keurig provided a variety of fun flavor options, the machine and pods were still relatively too expensive. The machine was priced between US$299 – $369, over 4.5x the price of popular SodaStream retailing at US$79. Additionally, each pod producing 8 oz. of soda cost between US$0.99 – $1.29, versus SodaStream’s pricing of roughly US$0.11 – $0.17 for an equivalent cup. Less than a year after launch, Keurig pulled the product and kindly refunded customers.
Once launched, it’s hard to make changes to the price of your product. Therefore, it is best to speak to potential customers prior to going to market.
How do I determine the price of my product?
What may seem like the logical approach is to ask a potential buyer outright “how much would you pay for this product?” However, the pitfalls of this approach include:
- Most people have a range of acceptable prices they are willing to pay. Asking them outright can result in “lowballing” to motivate companies to lower their prices; and
- Consumers could be genuinely unsure since a lot of purchasing decisions come down to emotions.
Therefore, it is important to consider the price range, or price sensitivity, which indicates the percentage of sales your company could lose, or gain, at any particular price.
Introducing the Van Westendorp Price Sensitivity Meter
Developed by Dutch economist, Peter Van Westendorp, this approach asks a consumer four questions related to their willingness to pay for a product:
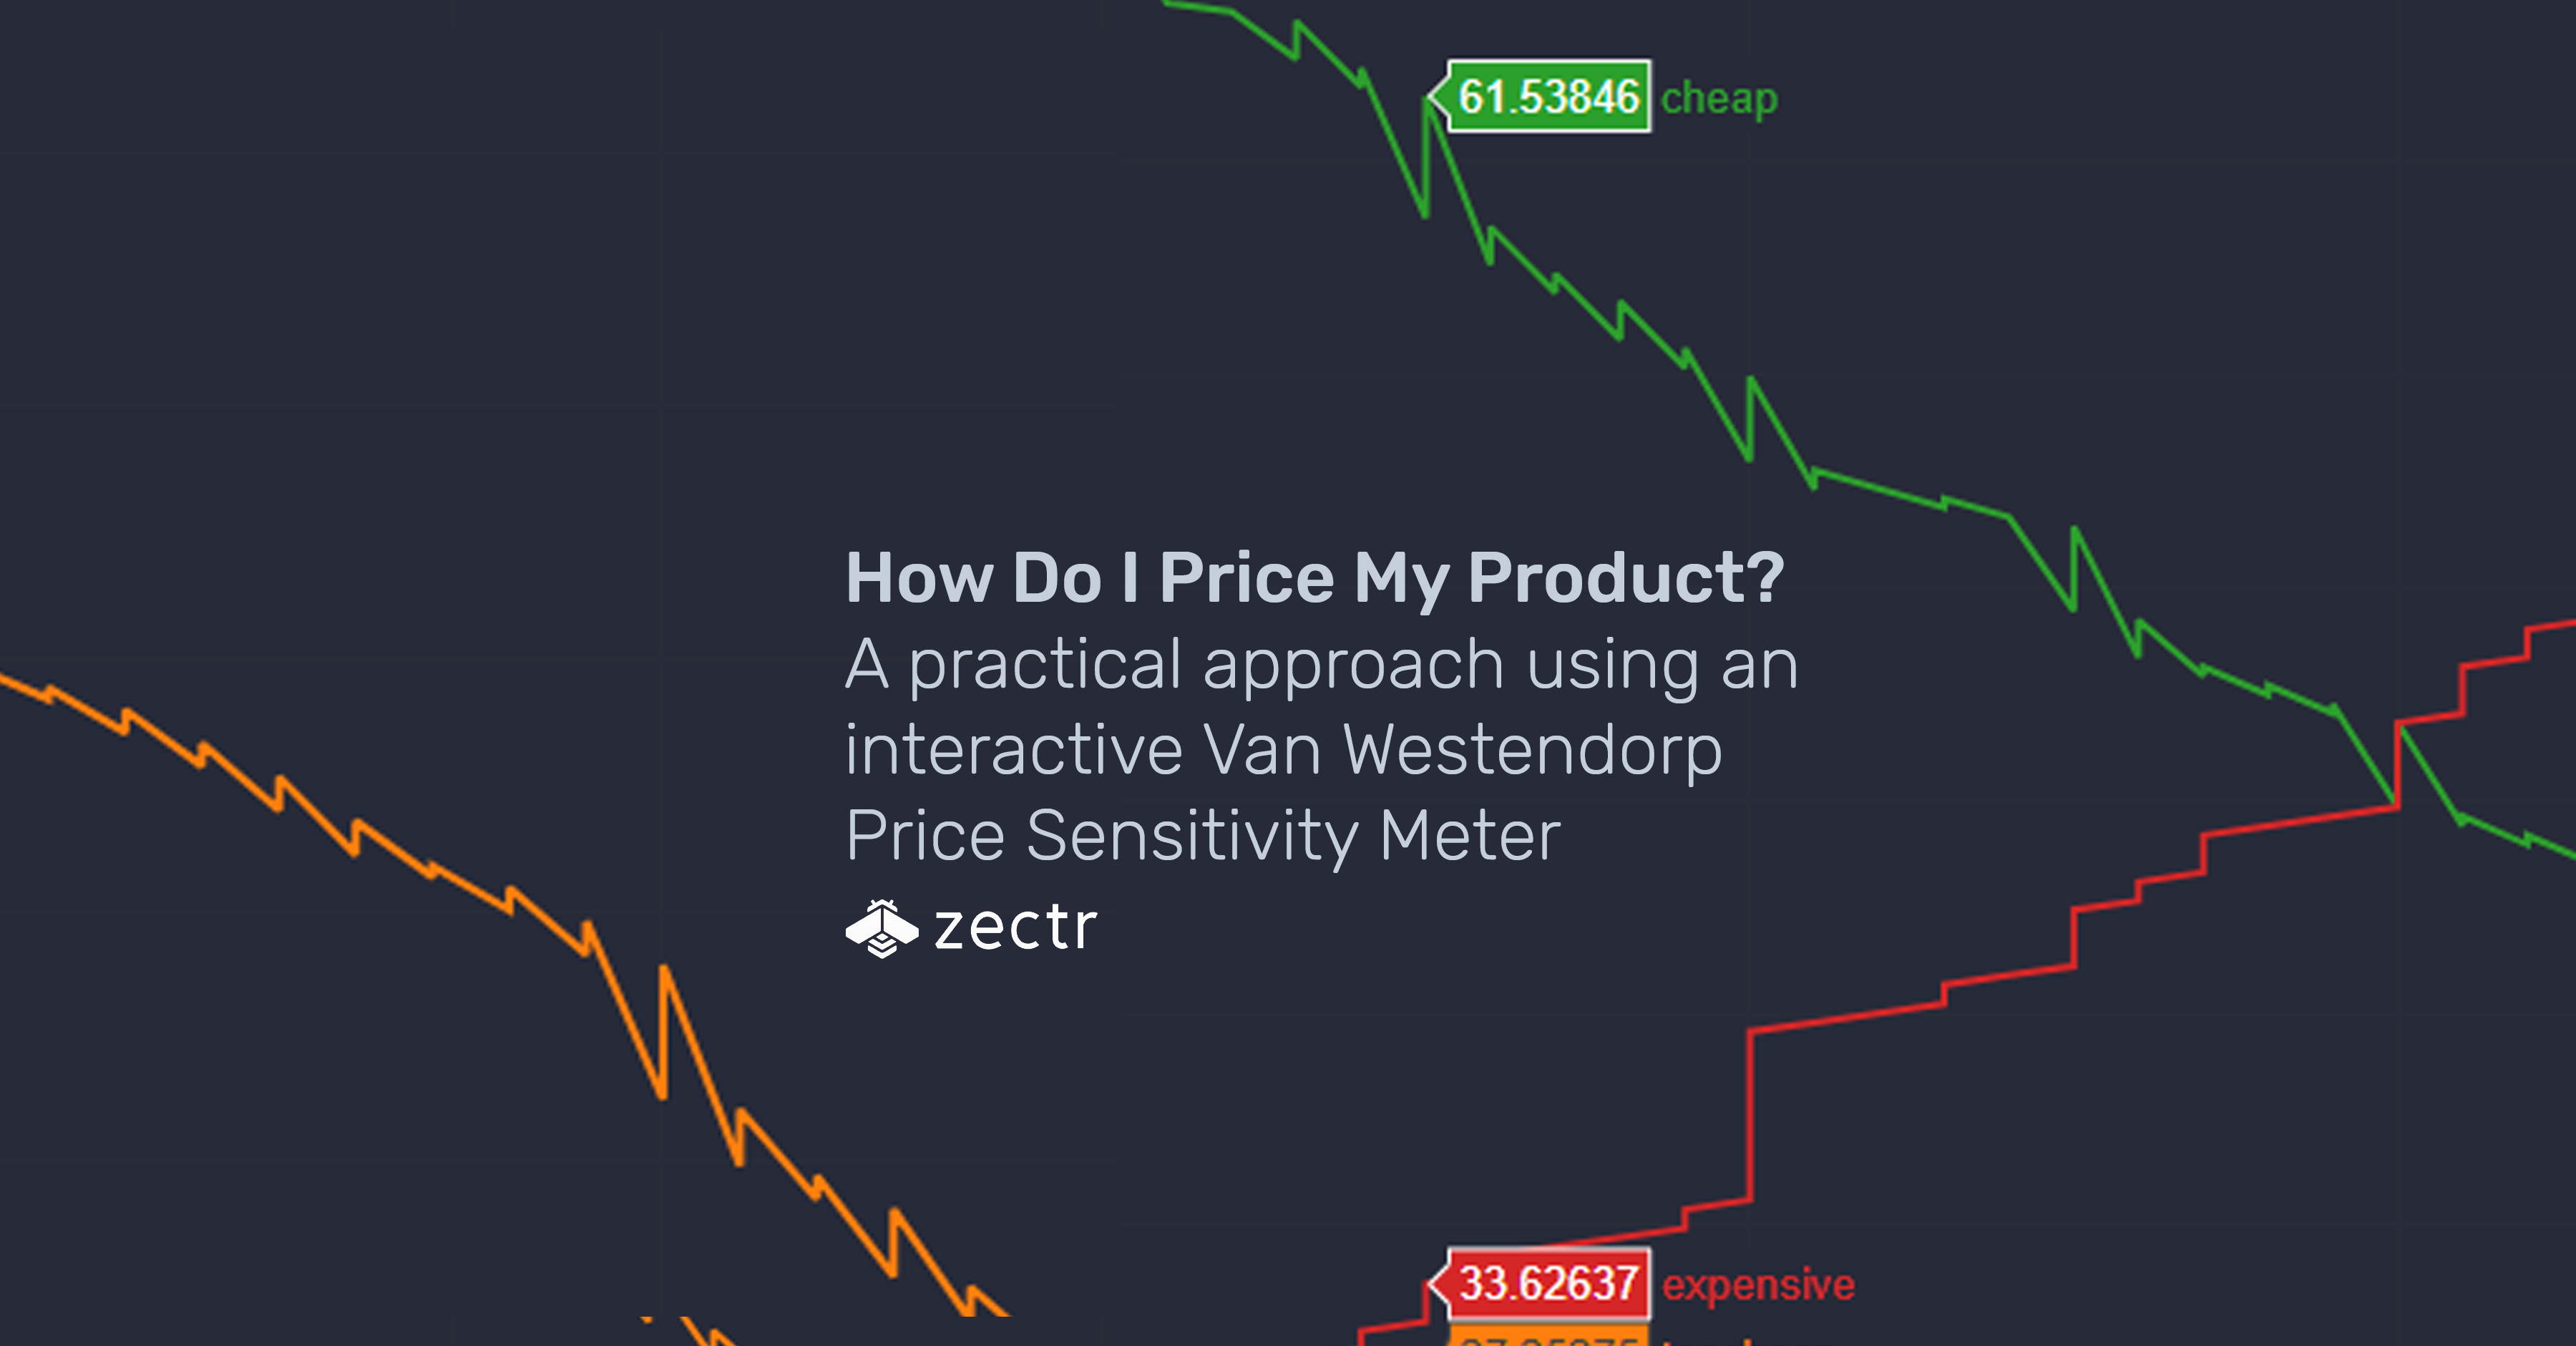
- “At what price would it be so low that you start to question this product’s quality?” Charted as “too cheap” represented in orange below.
- “At what price do you think this product is starting to be a bargain?” Charted as “cheap” represented in green.
- “At what price does this product begin to seem expensive?” Charted as “expensive” represented in red.
- “At what price is this product too expensive?” Charted as “too expensive” represented in blue.
Once a statistically significant number of potential buyers answer these questions, you can chart the responses and determine the lowest price point (known as the Point of Marginal Cheapness), the “sweet spot” (called the Optimal Price Point or OPP), and the highest price you can charge (or the Point of Marginal Expensiveness).

As illustrated above, if, hypothetically, Keurig had used Zectr’s platform to survey customers using the Van Westerndorp method, we would have helped them determine the optimal price point to charge for their Keurig Kold.
To demonstrate how to identify each point listed above, let’s reference fig. 2 featuring a screenshot taken from our platform filled with sample, dummy data. In this screenshot, the Point of Marginal Cheapness (intersection between “too cheap” and “expensive”) would be US$60, the Point of Marginal Expensiveness (intersection between “too expensive” and “cheap”) would be US$101, with US$86 representing the Optimal Price Point (intersection between “too expensive” and “too cheap”).
How Zectr Can Help
Other market research agencies can, and widely do, help you chart the Van Westendorp Price Sensitivity Meter of your product. They can also run simulated tabulations for different interested consumer segments within 1-2 days.
Using our turnkey Zectr market research and analytics platform, you can run your own tabulations of subsegments yourself with a click of a button. This is represented by our subgroup filtering function (viewable in the image below) and gives you direct access to determine pricing strategies for different subsegments using both demographic and psychographic data instantly.

To find out how we can help you determine the optimum price point of your product or service, identify which subsegments are representative of your niche, and learn how our Zectr platform works, feel free to schedule a demo here.
Rohini Chugani // Senior Marketing Strategist @ Zectr