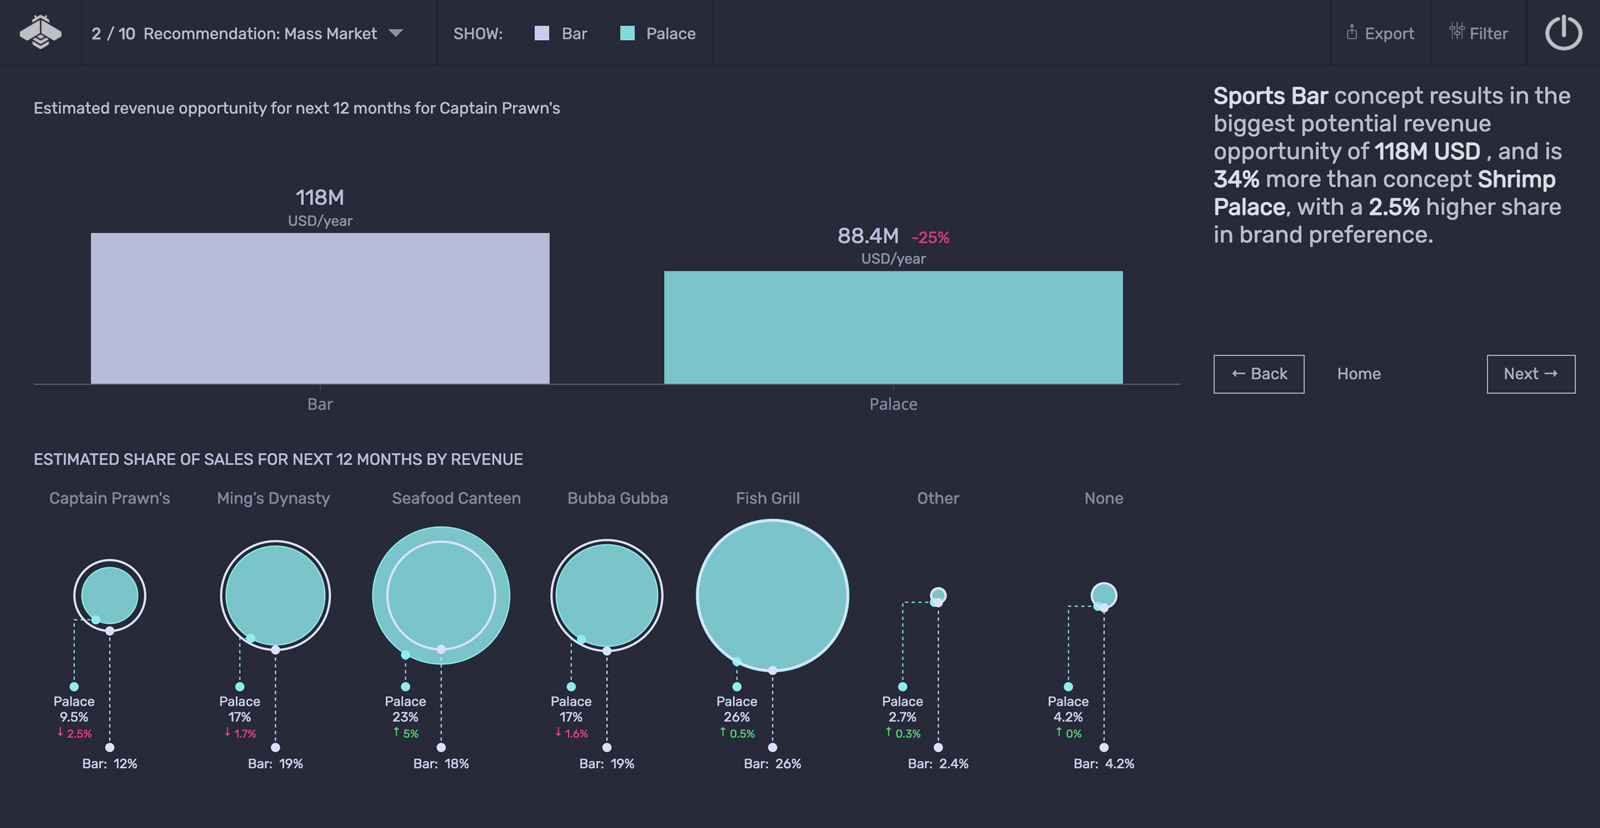
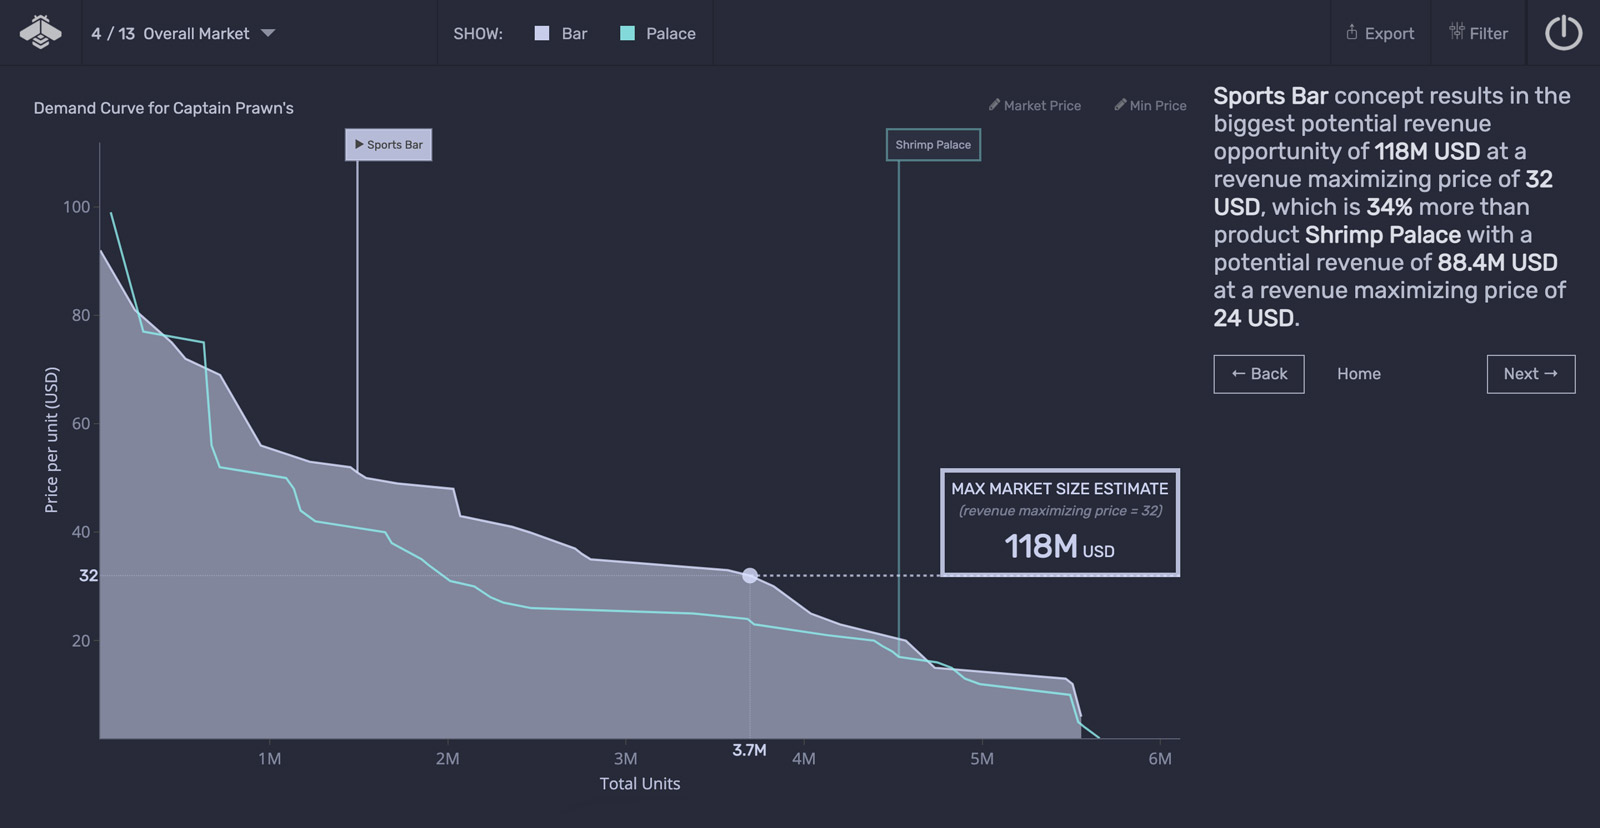
- Why Zectr? Why Zectr?#
- Platform https://www.zectr.io/wp-content/uploads/2021/04/Concept_Screening-1.pngPreview our platform and understand the core benefitsPlatformhttps://www.zectr.io/platform/
- Features https://www.zectr.io/wp-content/uploads/2021/04/Product_Market_Calibration-1.pngLearn about our automated proprietary analyses and key platform capabilitiesFeatureshttps://www.zectr.io/features/
- Case Studies https://www.zectr.io/wp-content/uploads/2021/04/AI_Market_Segmentation.pngBe inspired by how other companies have used Zectr to growCase Studies/case_studies/
- Solutions Solutionshttps://www.zectr.io/solutions/
- Insights Insightshttps://www.zectr.io/insights/
- Reports https://www.zectr.io/wp-content/uploads/2021/04/Concept_Screening-1.pngReports/insights/?_insight_cat=9
- Blogs https://www.zectr.io/wp-content/uploads/2021/04/Product_Market_Calibration-1.pngBlogs/insights/?_insight_cat=10
- Articles https://www.zectr.io/wp-content/uploads/2021/04/AI_Market_Segmentation.pngArticles/insights/?_insight_cat=11
- Events & Webinars https://www.zectr.io/wp-content/uploads/2021/04/AI_Market_Segmentation.pngEvents & Webinars/insights/?_insight_cat=12
- Support Supporthttps://www.zectr.io/?page_id=18
- Company Companyhttps://www.zectr.io/company/
- Enterprise Enterprisehttps://www.zectr.io/enterprise/